Support AirQuality.city
AirQuality.city is an independent hobby project. Donations help cover hosting, sensors, enclosures, replacement parts and expansion of the local monitoring network.
Explainers on air quality, how it is measured, and how to read the data.
AirQuality.city is an independent hobby project. Donations help cover hosting, sensors, enclosures, replacement parts and expansion of the local monitoring network.
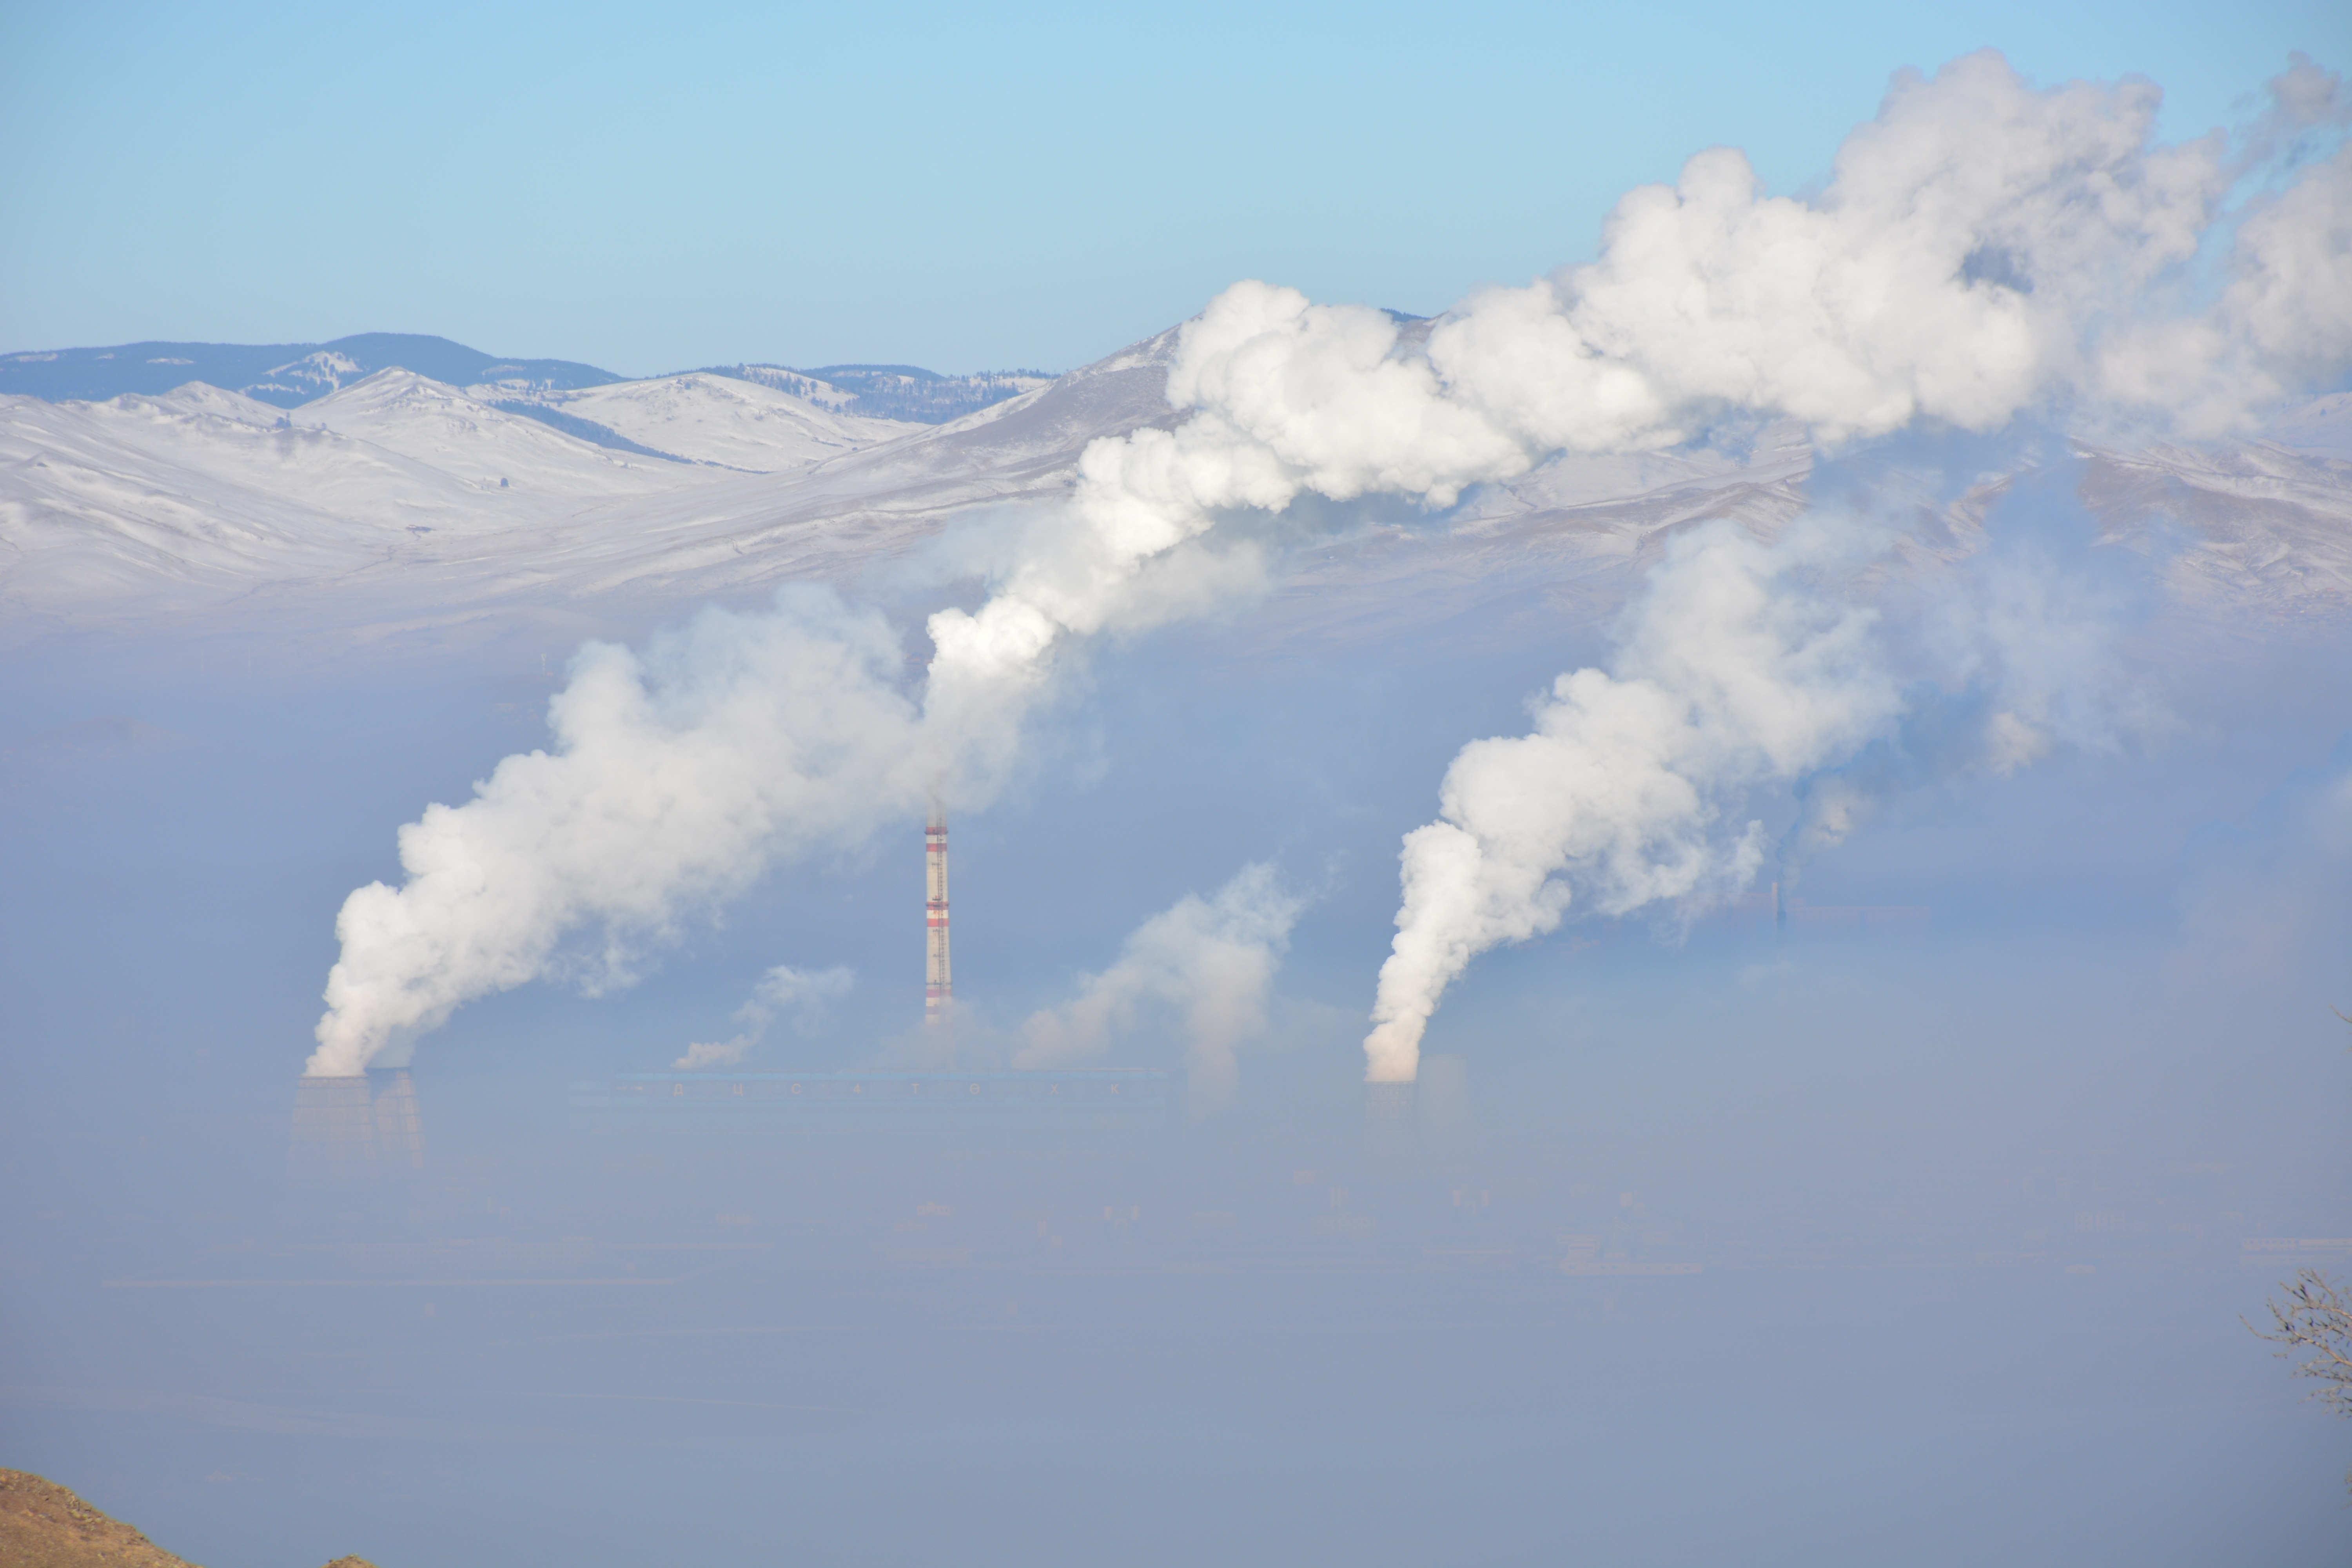
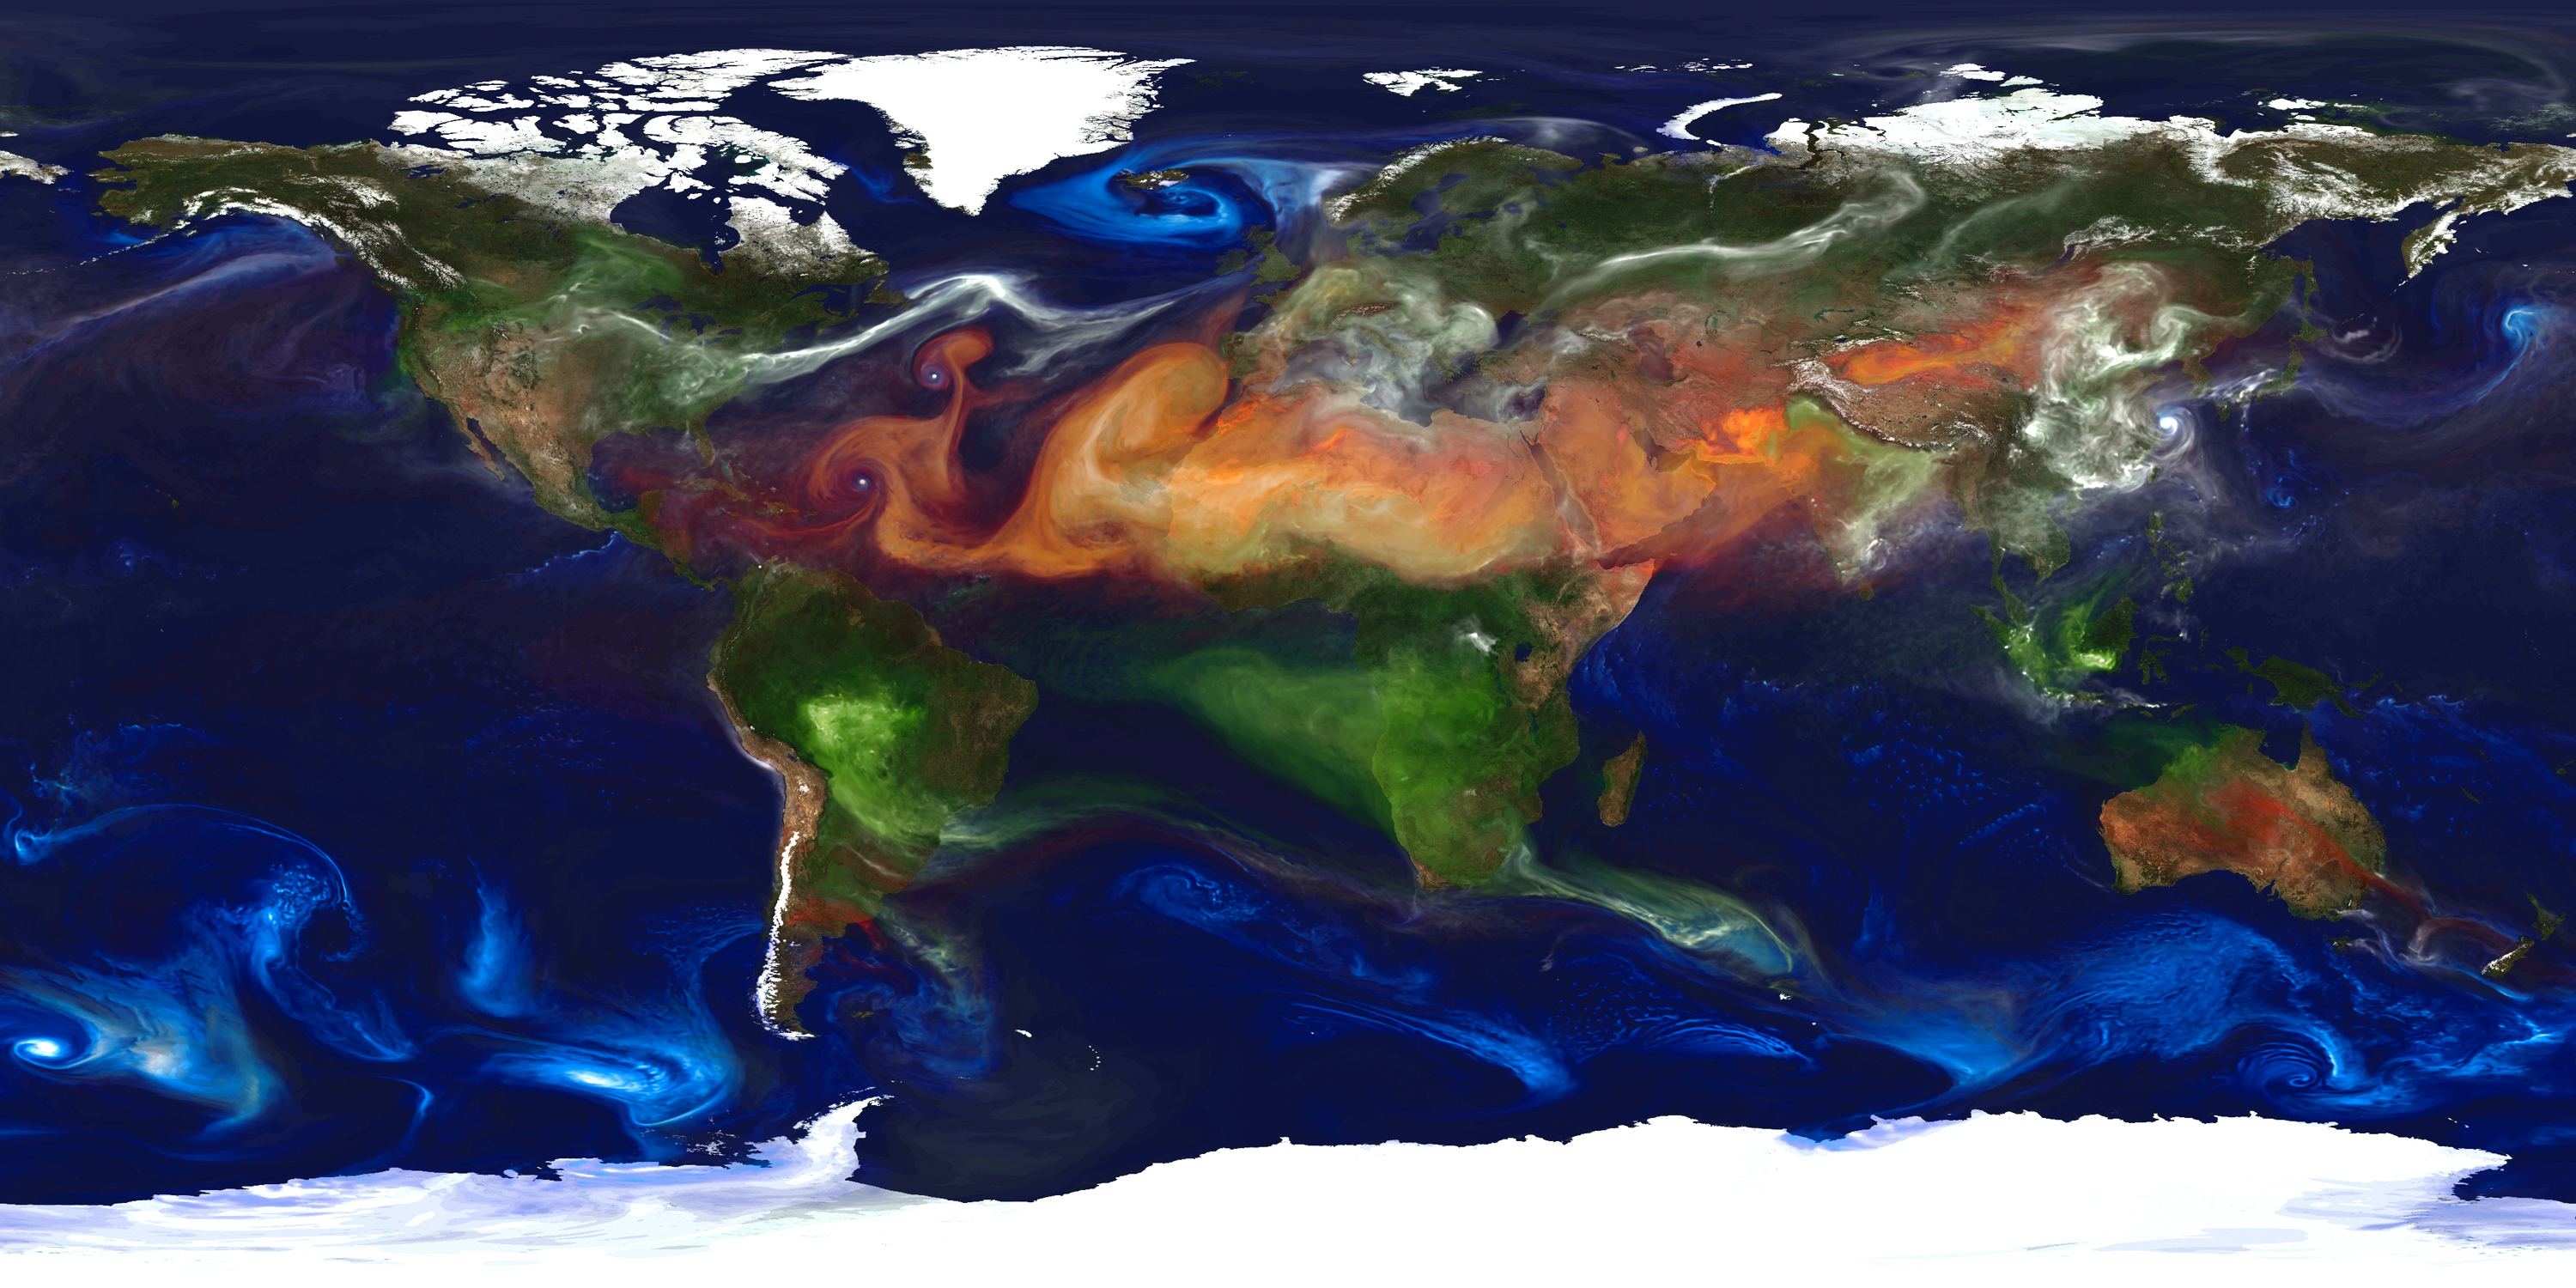
Croatia does not have one uniform air-quality level. Traffic, heating, industry, terrain, wind, fires and Saharan dust can change conditions from hour to hour and place to place.
Short answers to the questions that most often come up around AQI, PM2.5 and PM10, differences between services, fog, sensors and official monitoring stations.
AQI is a useful starting point, but better interpretation also needs concentration, timestamp, trend, station location and the pattern at nearby sites.
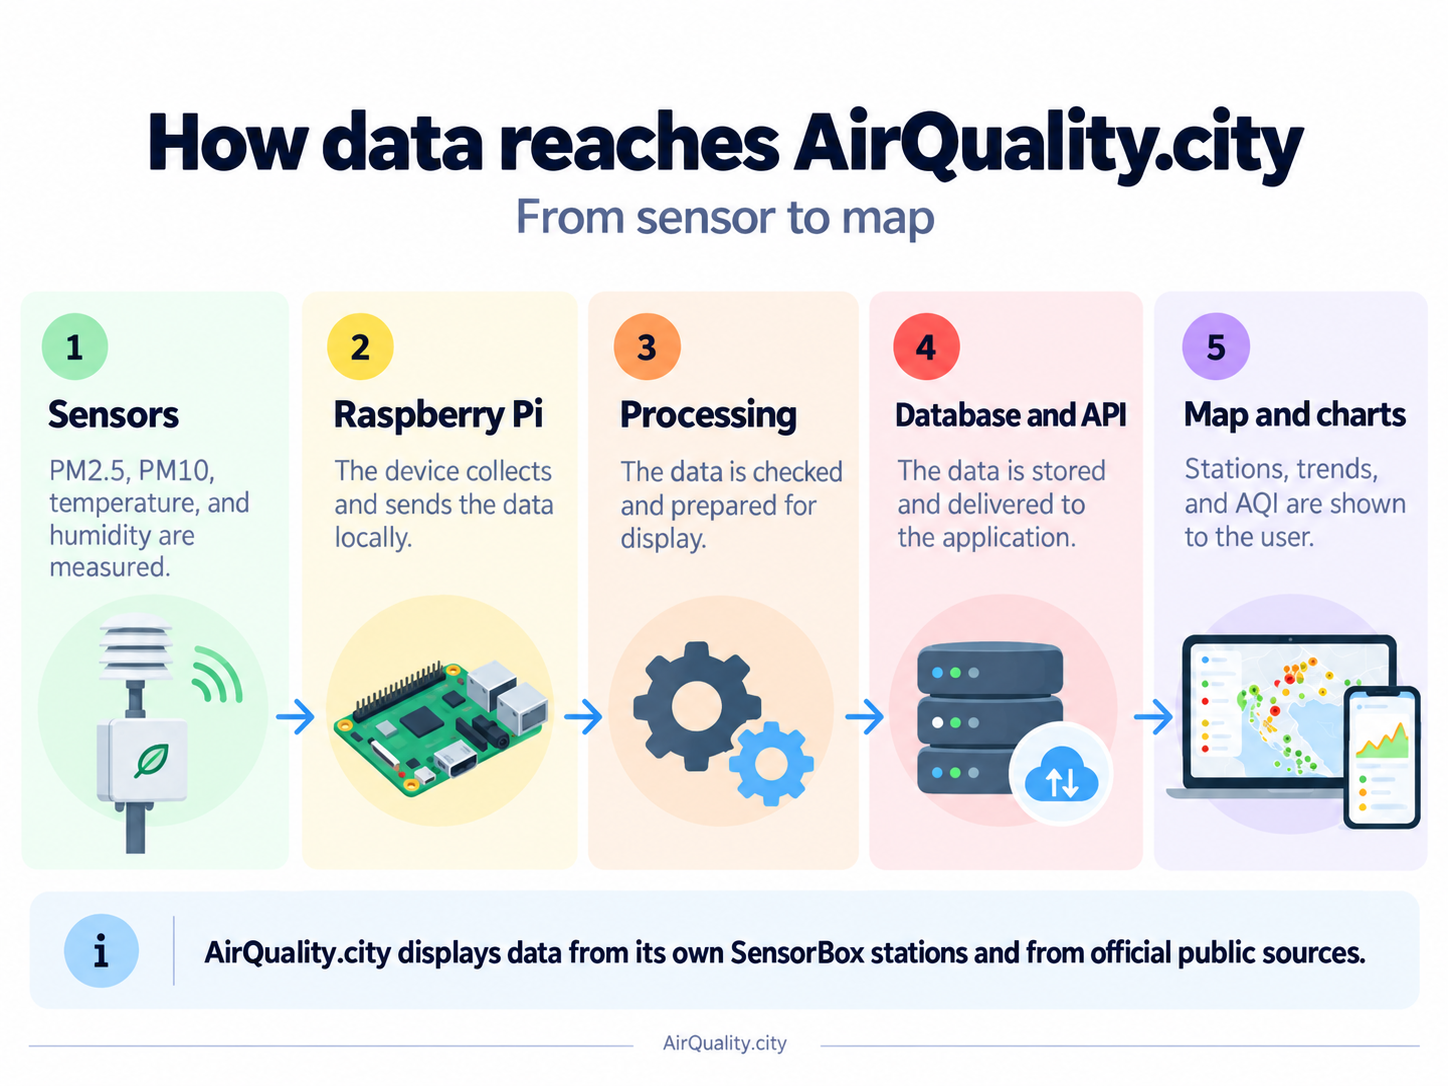
AirQuality.city combines its own SensorBox stations with official monitoring networks. The data is produced differently, so the portal keeps those differences visible rather than hiding them.
A different colour or number does not automatically mean that one service is wrong. The difference may come from another station, index, averaging period or pollutant set.
AirQuality.city processes only the information needed to operate and protect the website, communicate with users and send the newsletter. We do not use analytics or advertising cookies.
Rules governing the use of AirQuality.city, including the purpose of the portal, data limitations, permitted use of content and liability.
AirQuality.city is an independent hobby project combining local SensorBox measurements with publicly available official data to make air quality easier to follow and understand.
AirQuality.city grows through new monitoring locations, technical contributions and people willing to help make local air-quality data more accessible.
Technical documentation covering data sources, SensorBox processing, the PM index, timestamps, official monitoring data and the limitations of AirQuality.city measurements.
AQI makes air quality easier to scan, but it is not a universal measure. The US and European systems use different thresholds, averaging rules and pollutant sets.
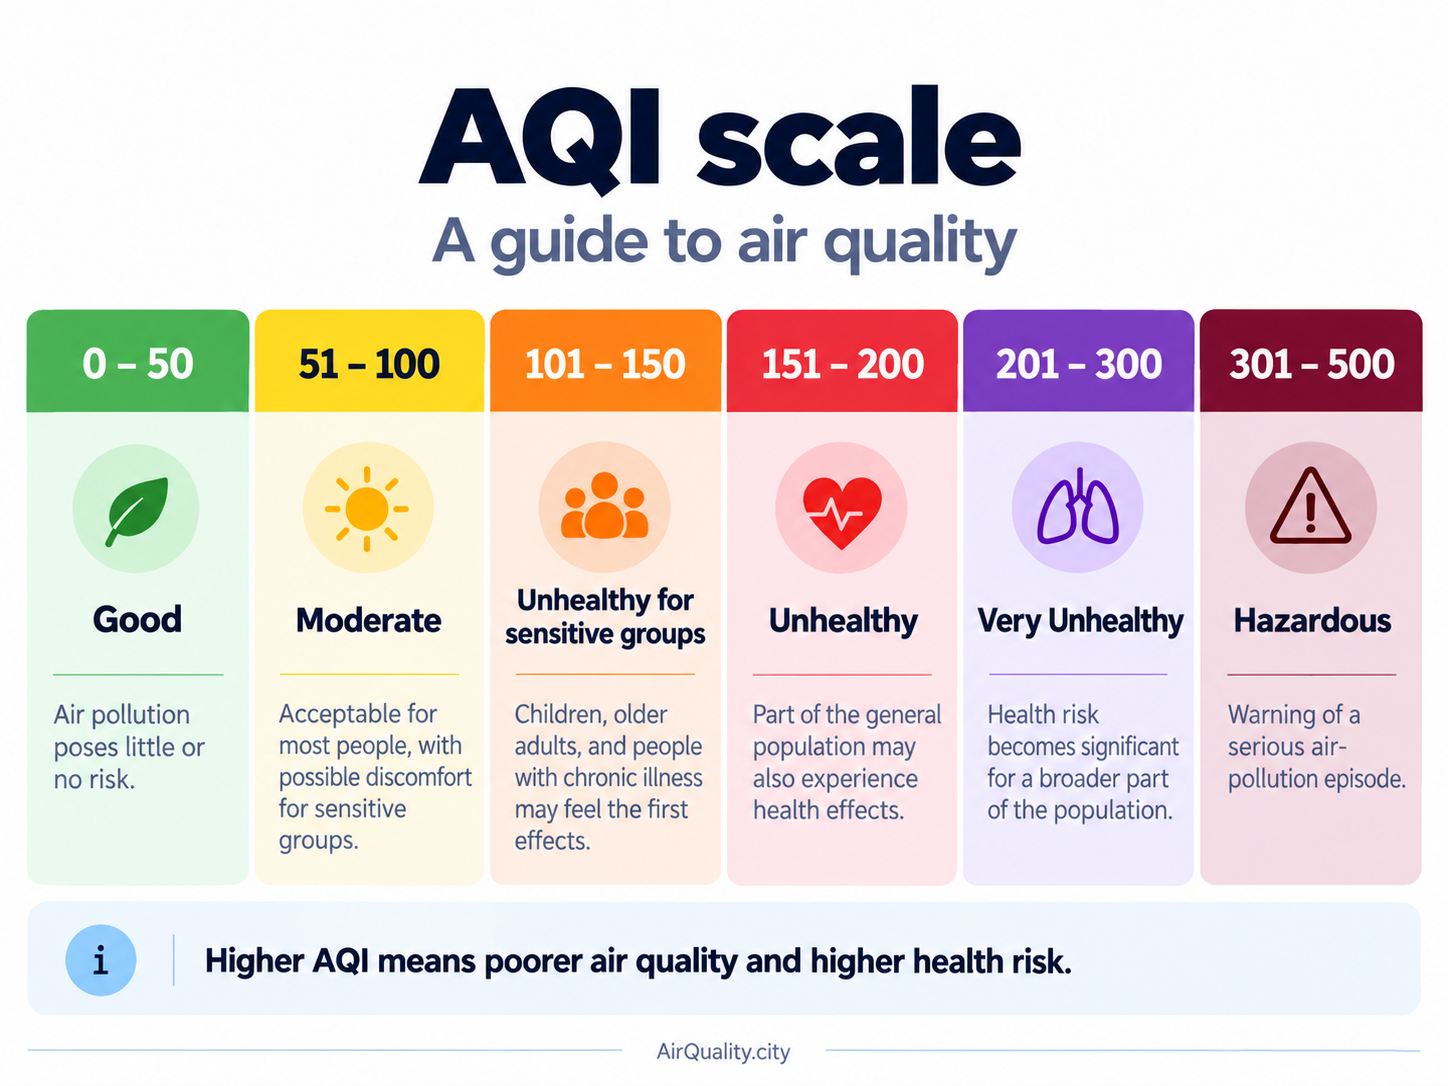
AirQuality.city uses the six U.S. EPA AQI categories for PM2.5 and PM10. The number is useful for quick interpretation, but category boundaries are not sudden physical changes in the air.
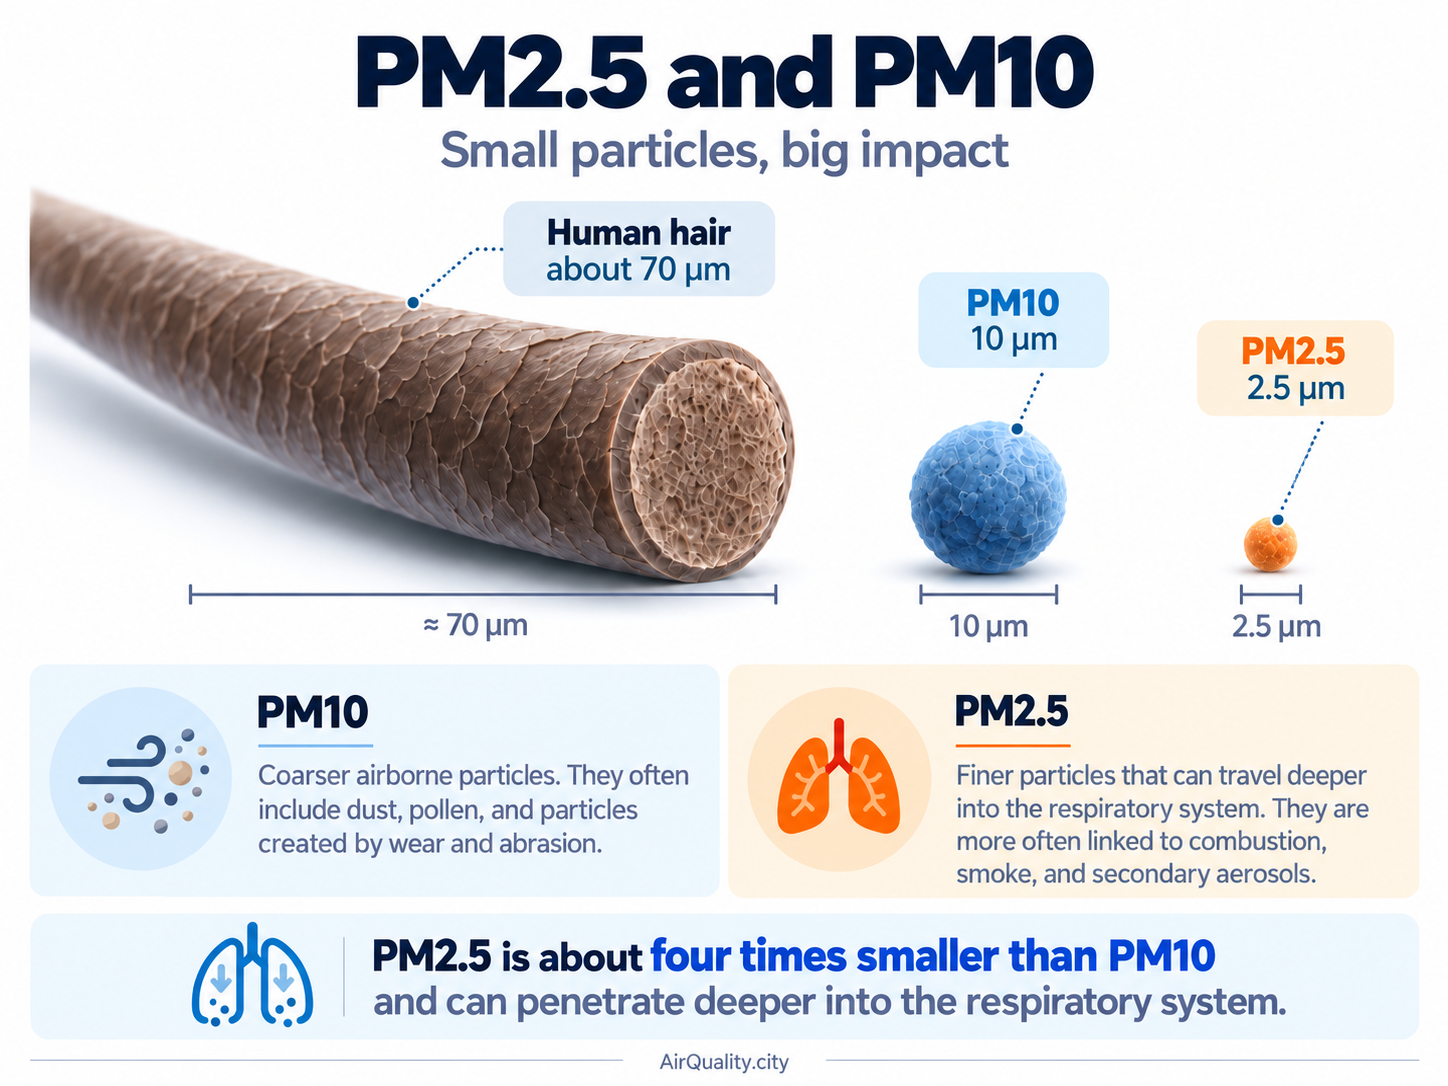
PM2.5 and PM10 are not two chemicals but two particle-size fractions. They differ in sources, atmospheric behaviour and how deeply they can penetrate the respiratory system.
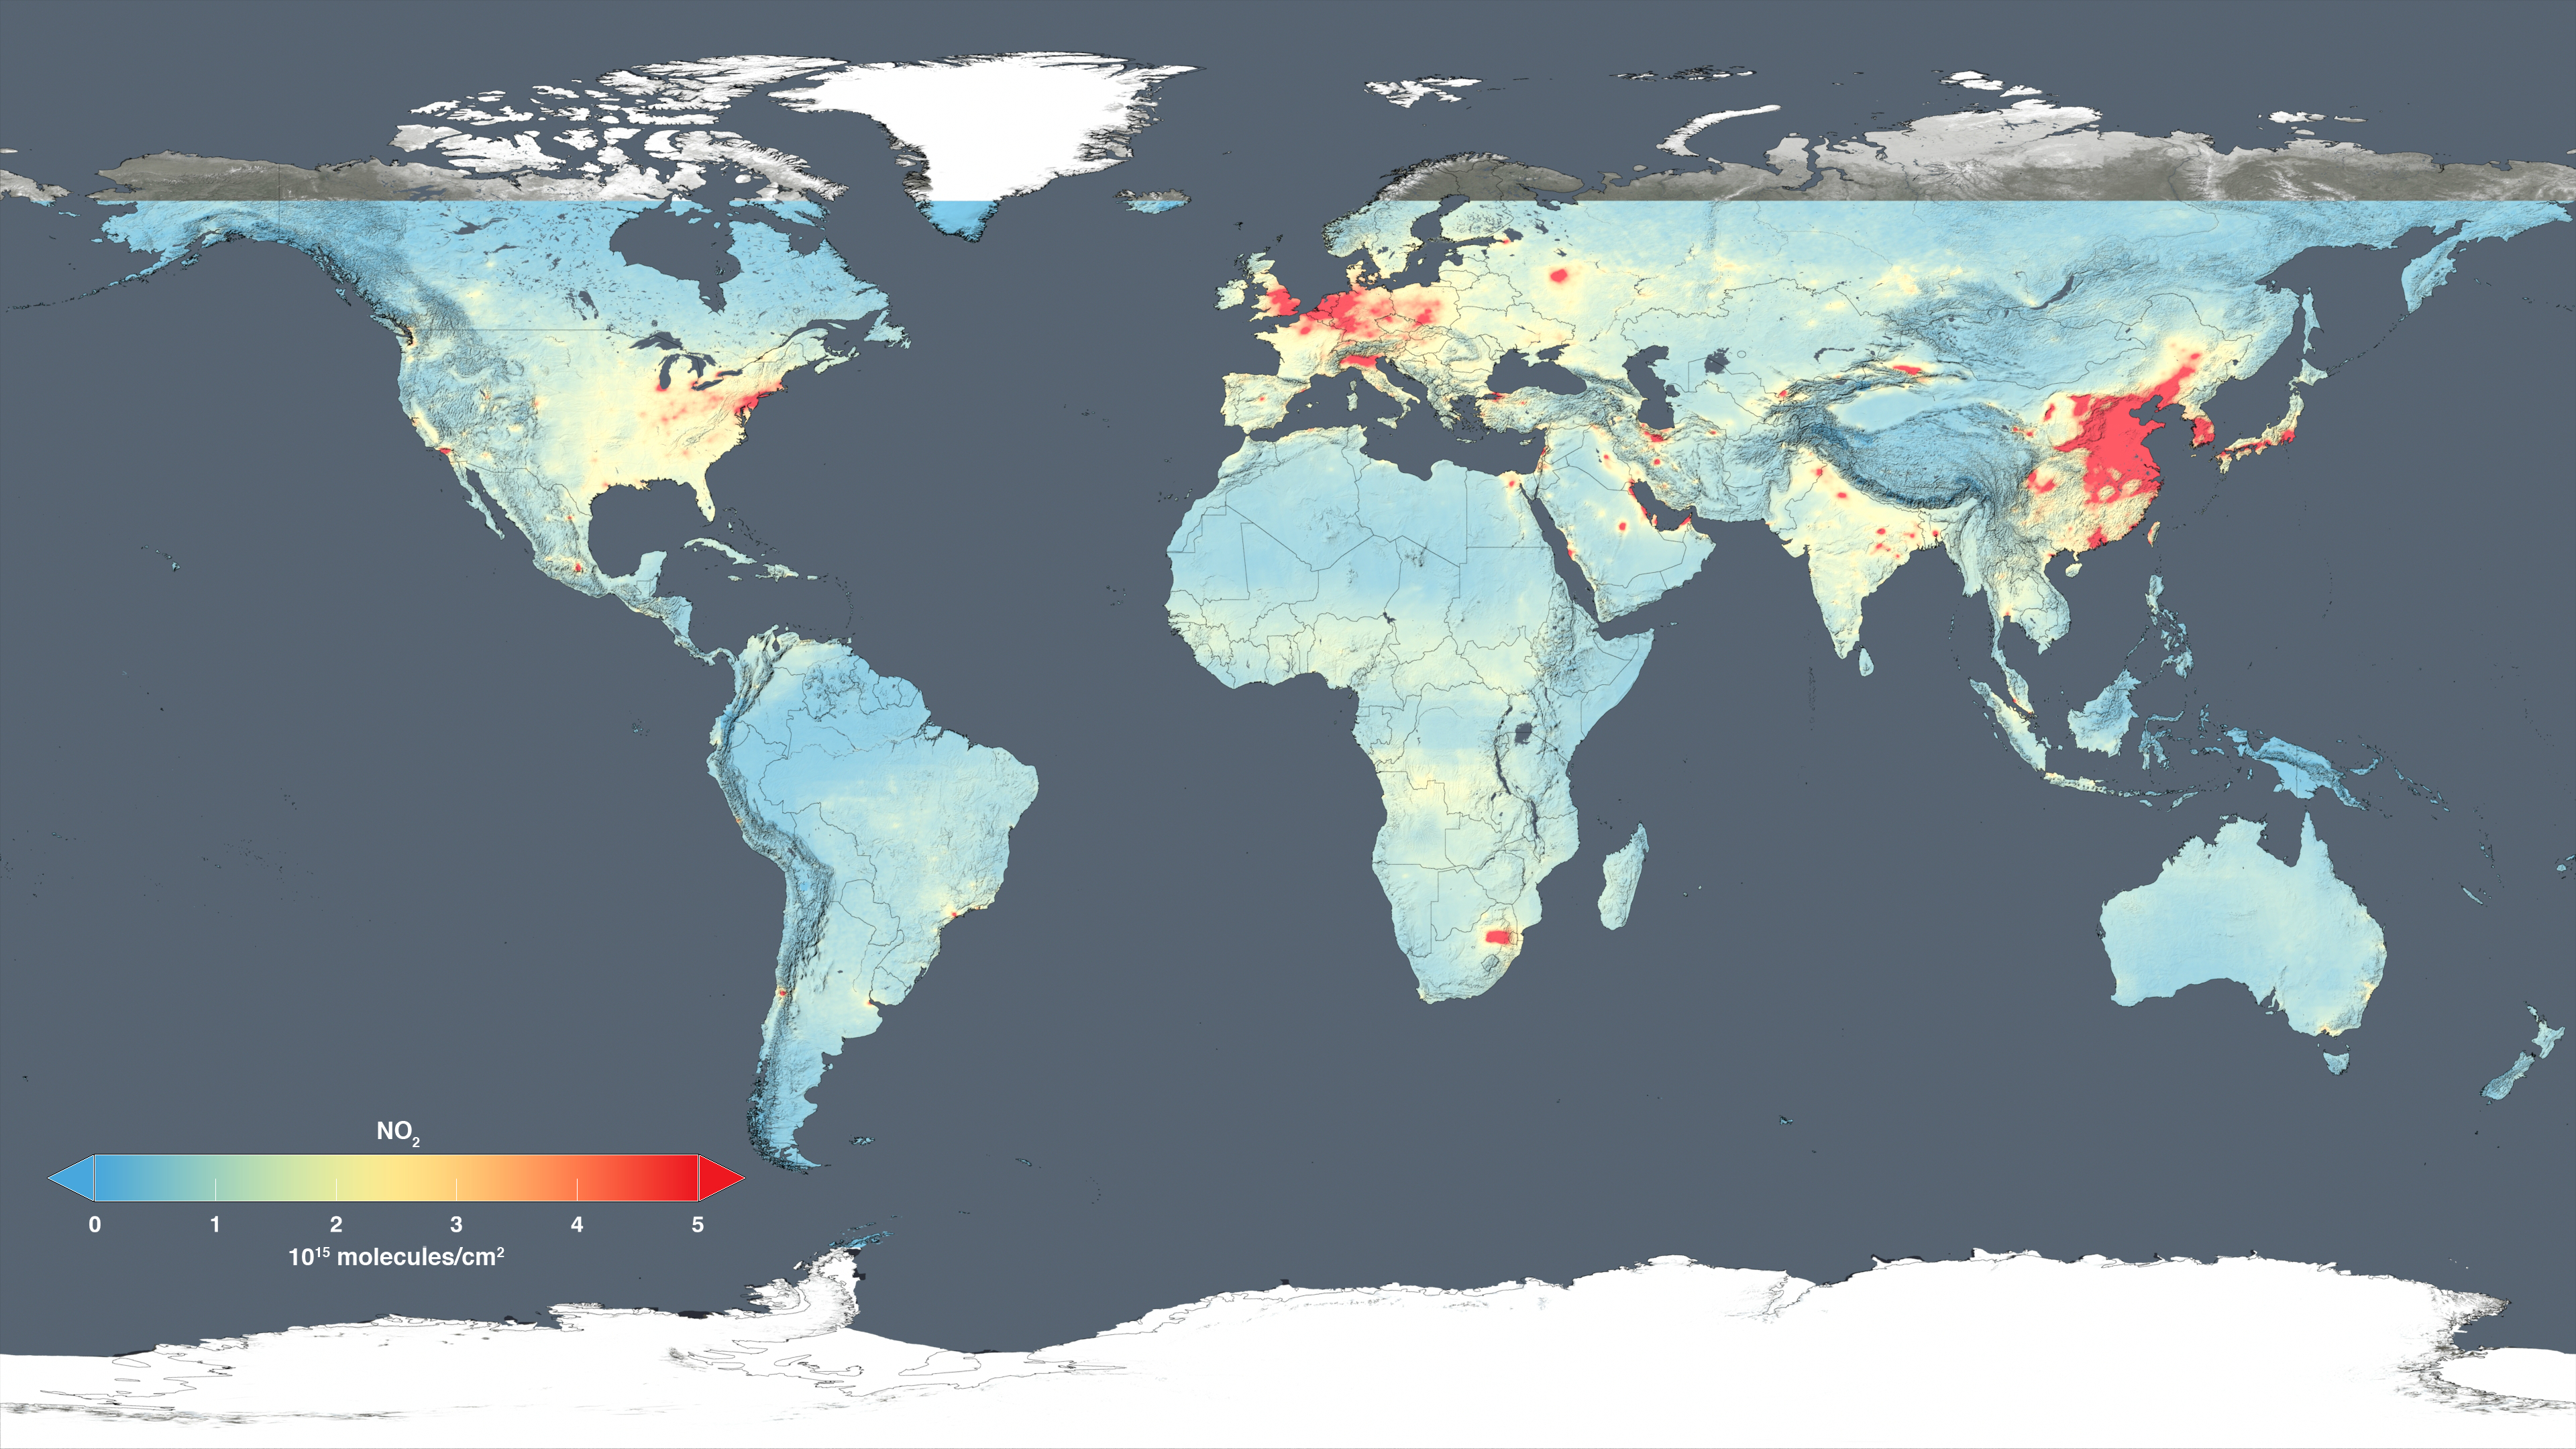
Particulate matter is not the only air-quality concern. Official stations also monitor nitrogen dioxide, ground-level ozone, sulphur dioxide and carbon monoxide, each with different sources and behaviour.
AirQuality.city combines several data sources, checks freshness and displays concentrations, trends and a PM index while keeping the limitations visible.