From measurement to display: the AirQuality.city methodology
AirQuality.city does not produce one single type of data. The portal displays its own SensorBox measurements alongside publicly available values from official monitoring stations, so the first rule of the methodology is to preserve the distinction between those sources.
SensorBox stations provide frequent local PM2.5 and PM10 measurements. Official stations serve a regulatory role, use different instrumentation and often measure a broader set of pollutants. They can appear on the same website without becoming the same kind of measurement.
Every value keeps its source and timestamp
For any station, the most important context is where the data came from and when it was measured. AirQuality.city tracks the latest valid reading and does not convert missing data into zero.
That distinction matters. 0 µg/m³ means an instrument reported zero; "no data" means there is no valid measurement for that time.
Official values arriving in real or near real time may still be preliminary. Croatia's public monitoring system explicitly notes that current measurements can later change during validation.[1]
SensorBox data is best read as a local signal
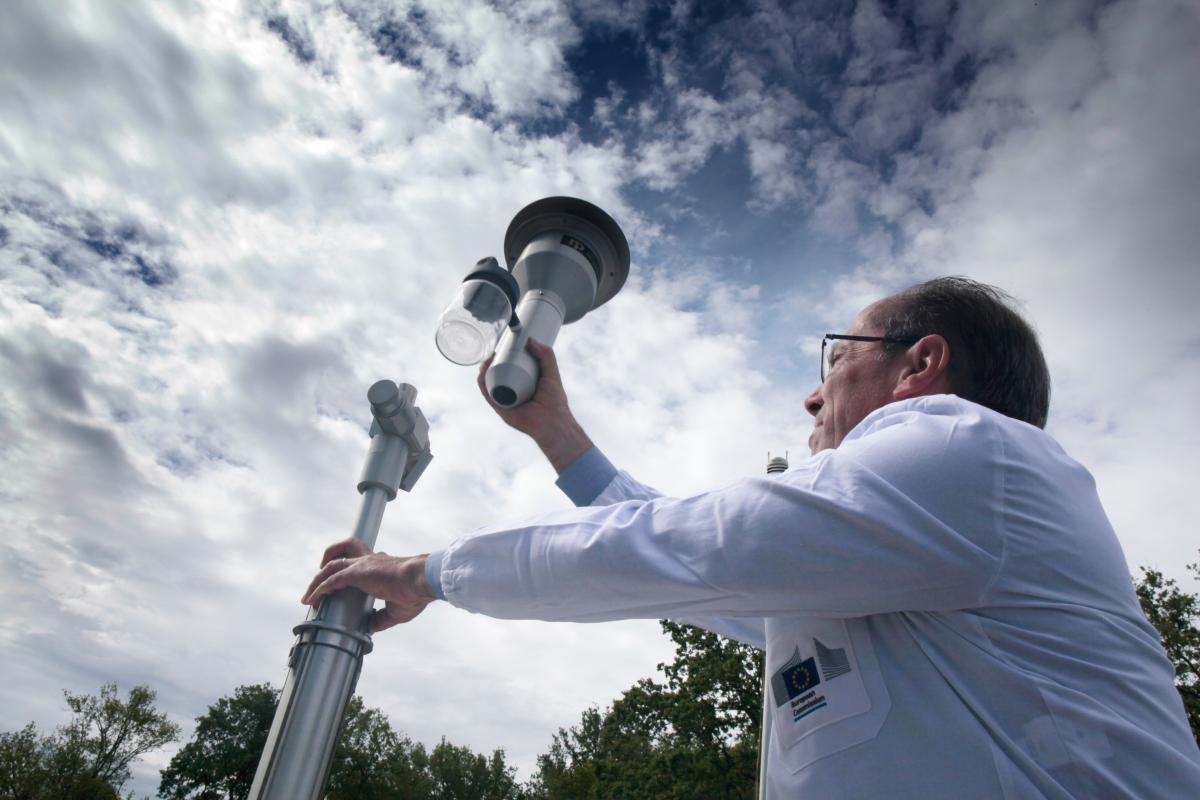
SensorBox uses a low-cost optical sensor to estimate PM2.5 and PM10. During a short measurement cycle, several readings are collected, the message is checked for basic technical validity and a processed value is stored.
This technology is useful for local trends and denser spatial coverage, but relative humidity, temperature, condensation, siting, airflow, sensor ageing and nearby sources can influence the result. The US EPA treats such systems as useful for informational and supplemental monitoring rather than as automatic replacements for regulatory instruments.[2]
The PM index is based on U.S. EPA concentration breakpoints
AirQuality.city calculates a separate index value for PM2.5 and PM10 using U.S. EPA concentration breakpoints. The less favourable of the two components becomes the station's overall PM index.[3]
The display uses six categories:
- 0-50: Good
- 51-100: Moderate
- 101-150: Unhealthy for Sensitive Groups
- 151-200: Unhealthy
- 201-300: Very Unhealthy
- 301-500: Hazardous
NO₂, O₃, SO₂ and CO may be displayed for official stations, but they do not enter the overall AirQuality.city PM index.
This is not the official EPA NowCast or the European index
The portal currently applies EPA breakpoints to the latest processed PM value. The official U.S. AirNow current-particle display uses NowCast, which combines several previous hours and adjusts their weighting according to how variable concentrations are.[4]
The European Air Quality Index is a different system again. It has its own concentration bands and can use up to five pollutants: PM2.5, PM10, NO₂, O₃ and SO₂.[5]
For that reason, the AirQuality.city number should not be presented as a universal AQI. A more precise description is a fast PM index based on U.S. EPA breakpoints.
A single spike is not automatically treated as proof of an event
The portal displays data after basic technical checks, but it does not attempt to infer a source from one elevated value. Meaningful interpretation needs the trend, nearby stations, meteorological conditions and the station's immediate surroundings.
A short peak on one sensor may be very local. A rise appearing across several distant stations and lasting for hours is much stronger evidence of a wider episode.
Detailed technical rules are kept separate from this overview
This page explains the display logic at a high level. The full list of data sources, SensorBox operation, AQI interpolation formula, sensor limitations and correction procedures are documented on Data sources and methodology.
The principle is simple: show data quickly, but never faster than it can be explained honestly.
Sources
- Kvaliteta zraka u Republici HrvatskojMinistarstvo zaštite okoliša i zelene tranzicije Accessed 2026-09-26
- Frequent Questions About Air SensorsU.S. Environmental Protection Agency Accessed 2026-09-26
- AQI BreakpointsU.S. Environmental Protection Agency Accessed 2026-09-26
- Using the Air Quality IndexU.S. EPA AirNow Accessed 2026-09-26
- European Air Quality IndexEuropean Environment Agency Accessed 2026-09-26