PM10 rising with no smoke or smog: how to spot Saharan dust
In late February 2021, snow in the Alps turned orange. A year later, in March 2022, a Saharan dust plume broke records for peak concentrations in southern Spain and reached Scandinavia in the days that followed. The Copernicus Atmosphere Monitoring Service (CAMS) lists both among the most important known dust episodes.[2]
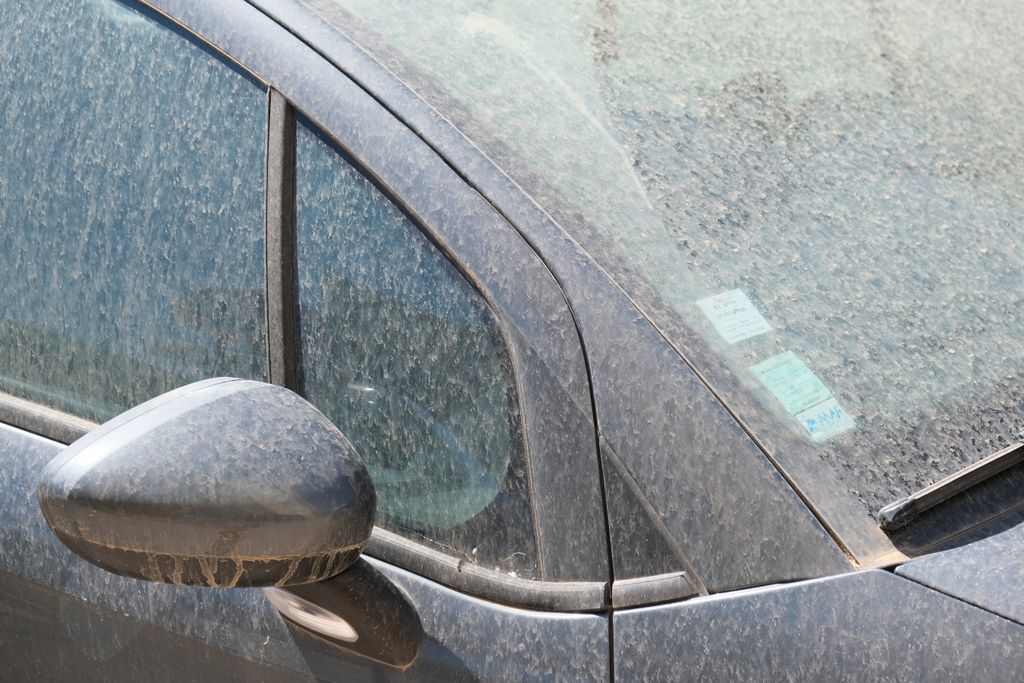
Most episodes leave quieter traces: a milky sky, warm-coloured sunsets, cars streaked with dirt after rain and poorer air. CAMS describes these as the most visible signs of dust transport.[2] On an air-quality map, an episode shows up as PM10 rising with no obvious local cause: no fire, no industrial incident, no winter smog. The source may be more than a thousand kilometres to the south. The European Environment Agency (EEA) lists Saharan dust, along with sea salt and volcanoes, among the natural sources of PM10.[4]
The Mediterranean between two dust sources
The Sahara is the world's largest source of atmospheric dust. According to a survey cited by CAMS, northern Africa accounts for around half of global dust emissions and Asia for about 40 per cent, mostly from the Middle East and Central Asia. The Mediterranean sits between the two and is especially prone to dust episodes.[2]
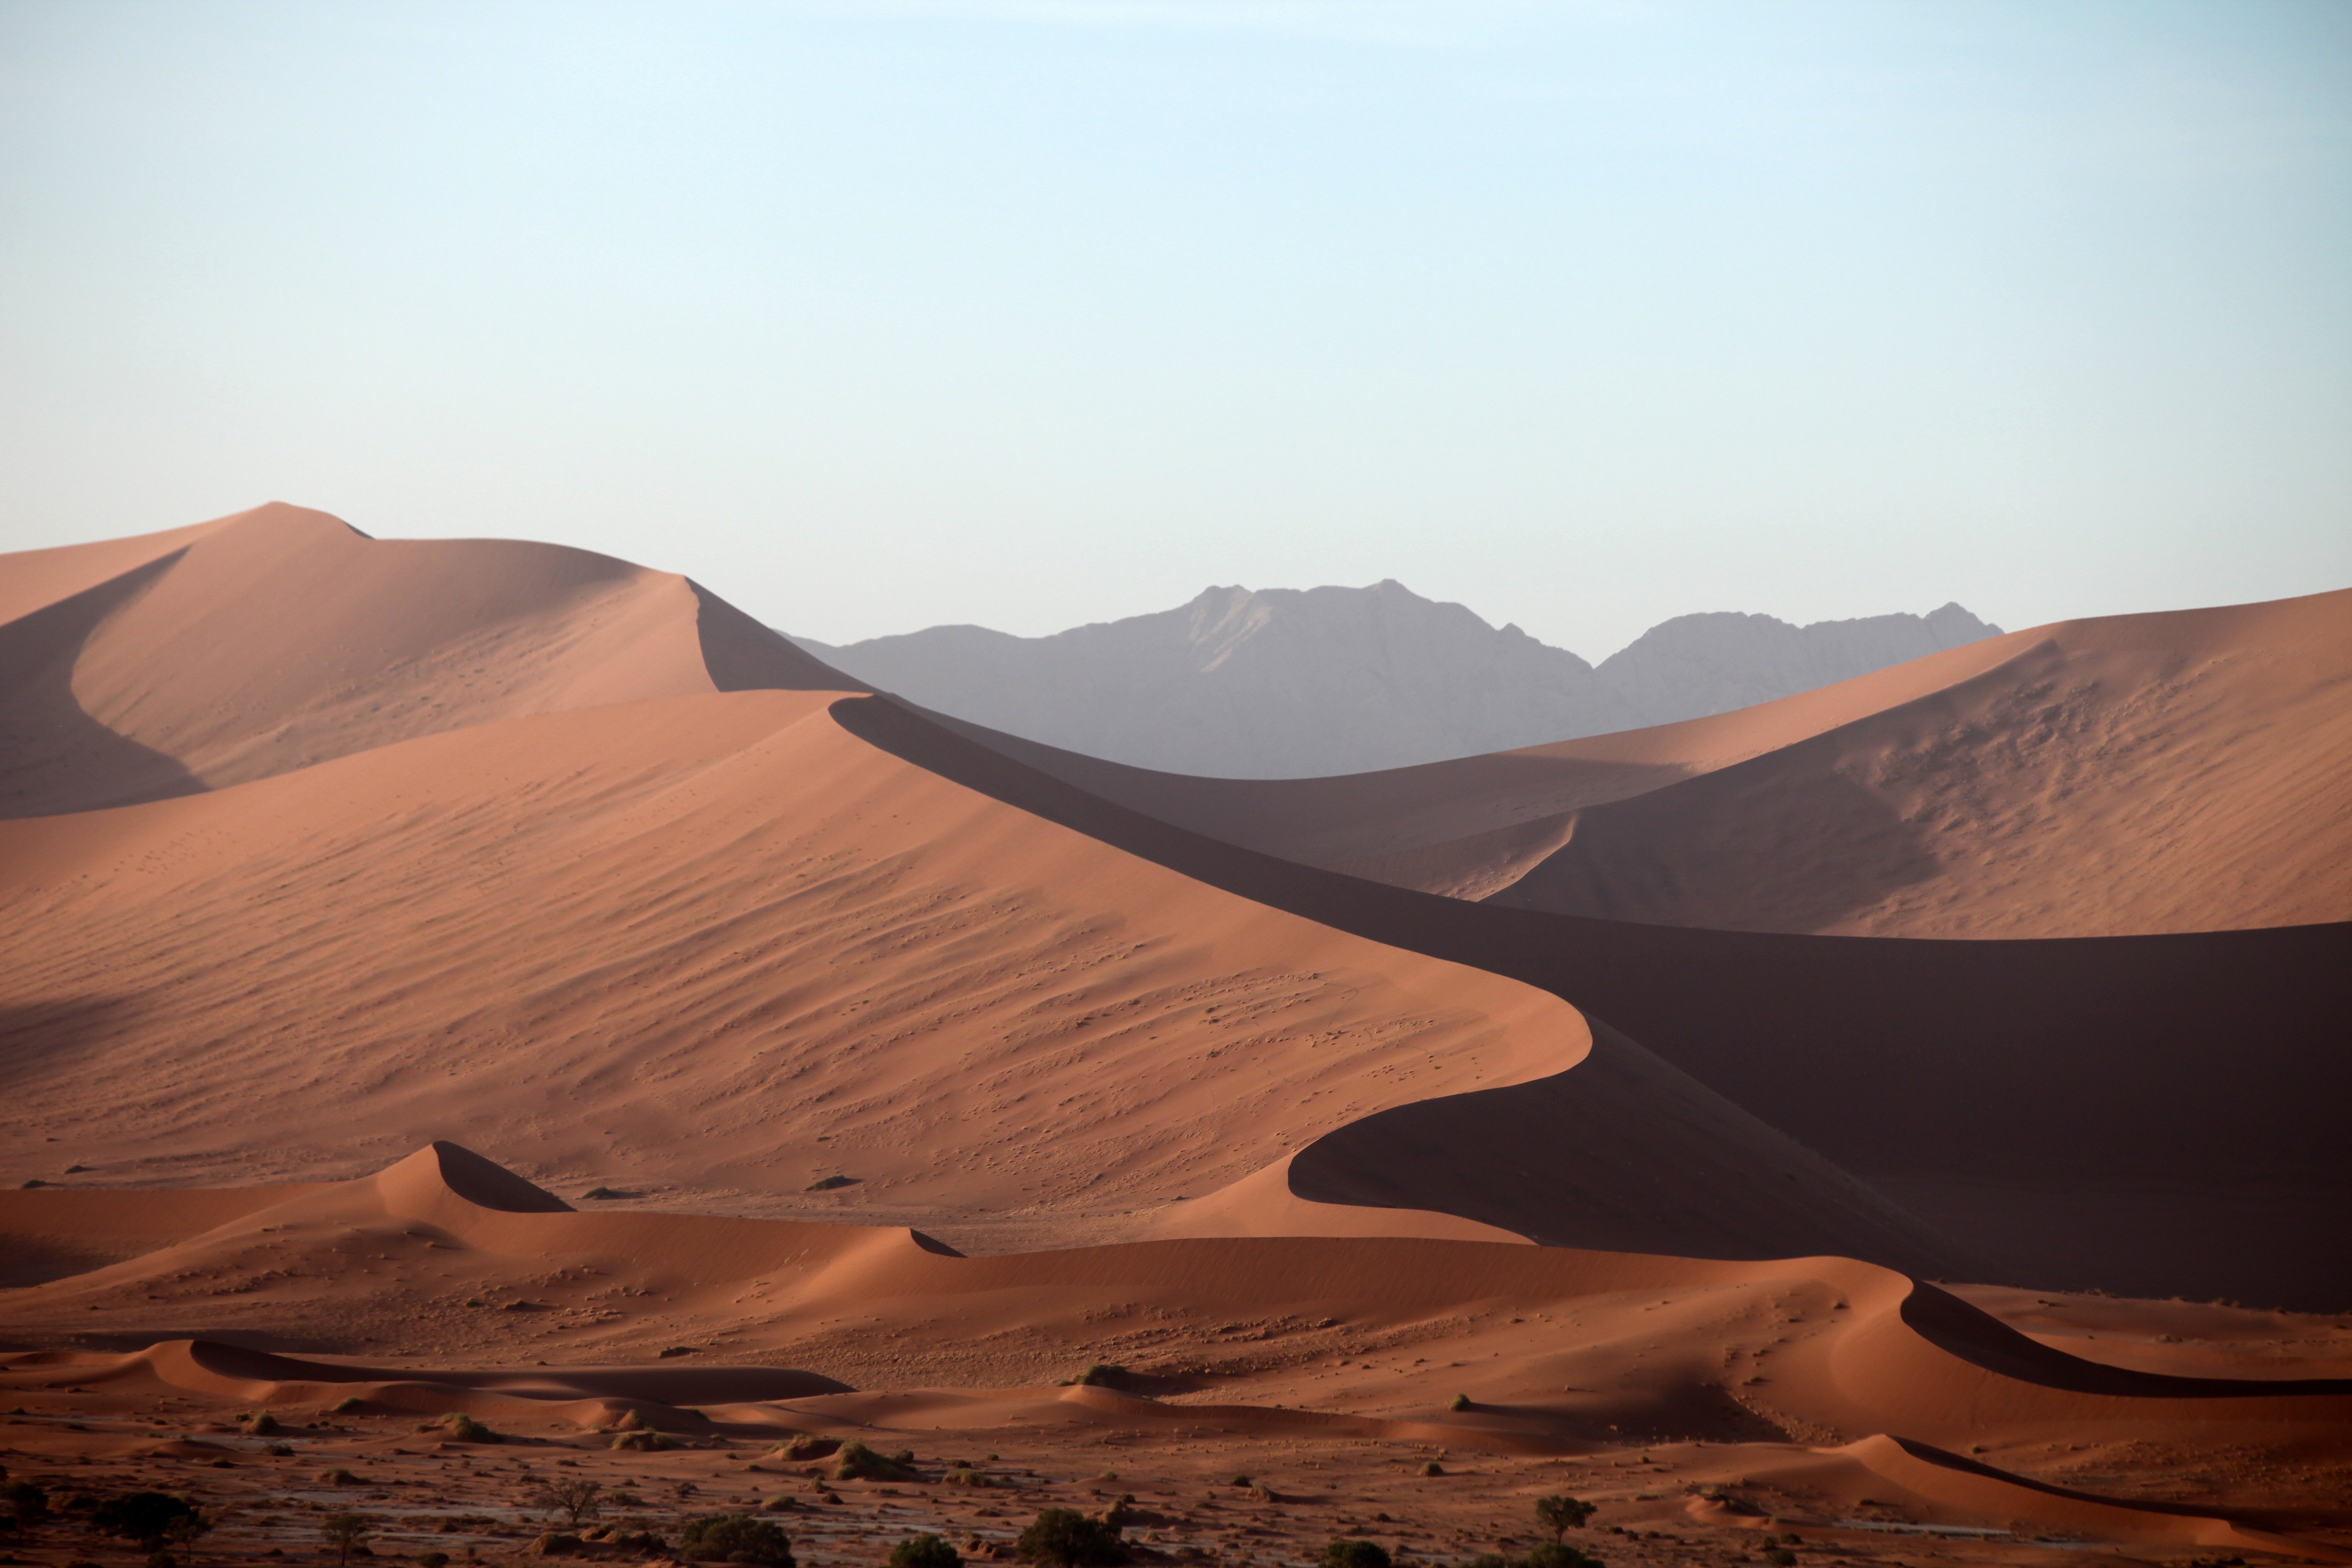
What crosses the sea is fine mineral dust, far finer than beach sand. Strong winds lift it into the upper troposphere, where it can stay for days or even weeks while the circulation carries it and deposits it thousands of kilometres away.[1] Early spring is the busiest season for Saharan dust reaching Europe.[2]
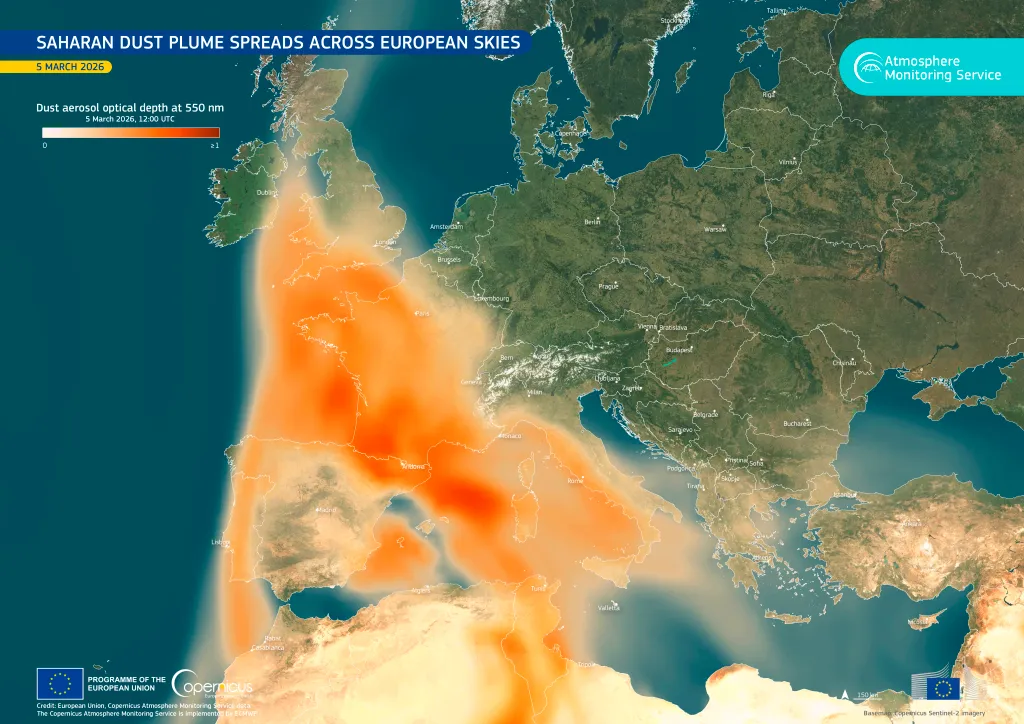
The first half of 2025 showed what a single season can bring. Between January and May, plumes regularly reached Italy and Greece, hazing the sky and bringing dust down to ground level. In early February a cyclone that formed over North Africa carried dust across the central Mediterranean to southern Italy and on to Greece. In March a large plume crossed the Iberian Peninsula into northern France, the Benelux countries and the UK, and in mid-April sirocco winds brought enough dust into southern Europe to turn the sky yellow.[1]
Why dust shows up in PM10
Mineral dust contains both coarse and fine particles, and CAMS tracks its effect on air quality mainly through PM10. It reported that the 2025 intrusions had a far-reaching impact on coarse particulate matter (PM10) concentrations.[1][2]
PM2.5 can rise too, by an amount that depends on the make-up of the plume, the distance travelled, deposition along the way and the weather. A sharp jump in PM10 with a modest rise in PM2.5 therefore points to plenty of coarse particles in the air, but it does not prove Saharan dust. Road dust, building sites and other local sources can produce the same pattern.[5]
Whether dust raises PM10 at ground level at all depends on how concentrated it is and how high it travels. A dust plume can pass through the upper atmosphere, haze the sky and colour the sunset without pushing ground-level concentrations particularly high. CAMS notes that dust travelling at altitude is less likely to have a significant effect on surface air quality, and that most of it is diluted until neither people nor instruments can detect it.[2][3]
A satellite image of a thick plume over the Adriatic does not mean that every station beneath it will record high PM10.
Natural origin and legal limits
When a dense plume does reach the ground, it brings both coarse and fine particles. CAMS says such dust degrades air quality and poses respiratory and even cardiovascular risks, although the concentrations shown to cause respiratory and heart disease usually occur close to the dust sources themselves.[2][3]
EU rules give natural sources special treatment. The daily PM10 limit is 50 µg/m³, which may be exceeded on no more than 35 days a year; from 2030 it falls to 45 µg/m³ with no more than 18 exceedances. When assessing compliance, member states may, under certain conditions, discount the contribution of natural sources, because these are beyond their control. The EEA does not subtract them in its annual status report, so the effect of dust remains visible there: in the Canary Islands some concentrations exceed the daily limit mainly because of Saharan dust.[4] Discounting changes the legal assessment, not the concentration that was measured.
Muddy rain
When a dust-laden air mass meets cloud and rain, the rain washes some of the particles out of the air. This wet deposition, better known as muddy or 'dirty' rain, is one of the best-known effects of dust transport and leaves spots of mud on cars, windows and other surfaces.[3]
The washout also lowers the amount of dust left in the air, so PM values can fall after rain. How quickly depends on whether more dust is still arriving and whether the air mass changes. At very high concentrations, deposition becomes a practical problem as well: it reduces visibility, damages machinery and cuts the output of solar panels.[2]
Regional episode or local source
One station cannot settle the question. The clues become convincing only together: PM10 rising at the same time at several distant stations, forecasts of dust transport from North Africa and satellite products showing a plume over the Mediterranean. CAMS works the same way. Its regional ensemble for Europe combines ground measurements with models and forecasts four days ahead, while its global model blends satellite observations with the forecasting system of the European Centre for Medium-Range Weather Forecasts (ECMWF) and updates its dust forecast twice a day for the next five days.[3]
A local source usually leaves a narrower footprint. A building site, traffic or dry soil can push PM10 up sharply at one station while another a few tens of kilometres away shows nothing similar. That rule has exceptions, so the map should be read alongside wind direction and how values develop over several hours.[5]
On the AirQuality.city map, start with PM10 and how it compares with PM2.5. The overall AQI is calculated for both fractions and shows the worse of the two, so it is worth checking which one drove it up. A gradual rise lasting hours across several stations points to a wider event, while a single short spike calls for a closer look at the sensor's surroundings and the instrument itself.[5]
If the sky is milky, PM10 is climbing at several stations at once and the CAMS forecast for the day shows dust over the Adriatic, the nearest chimney is probably not the main source.
Sources
- Frequent Saharan dust plumes tracked across the Atlantic and over EuropeCopernicus Atmosphere Monitoring Service2025-07-10 Accessed 2026-09-19
- What is desert dust and how does it change atmosphere and the air we breathe?Copernicus Atmosphere Monitoring Service2022-05-10 Accessed 2026-09-19
- Desert dust Q&AsCopernicus Atmosphere Monitoring Service Accessed 2026-09-19
- Particulate matter - PM₁₀ | Air quality status in Europe 2026European Environment Agency2026-04-30 Accessed 2026-10-21
- Jedan broj nije cijela slika kvalitete zrakaAirQuality.city2026-07-24 Accessed 2026-10-21