Why does air quality often get worse on winter evenings?
The first colder days often bring a familiar pattern: air quality looks acceptable in the afternoon, PM2.5 starts rising in the evening, and values at some stations can remain elevated for hours during a calm night. By morning, conditions may improve almost as quickly as they deteriorated.
This is not a coincidence. Winter air quality is shaped by both emissions and meteorology, and those two factors often become least favourable at the same time in the evening.
The European Environment Agency states that PM2.5 in Europe is emitted largely by the combustion of solid fuels for domestic heating, with additional contributions from industry and transport.[1] In some countries, burning biomass and fossil fuels for residential heating still makes a significant contribution to PM2.5 emissions.[3]
In the evening, both emissions and the atmosphere change
As temperatures fall, demand for heating rises. In neighbourhoods with many wood-burning or other solid-fuel stoves and boilers, a large number of small emission sources begin operating within a short period. Each chimney may be small, but their combined effect can be visible in neighbourhood-scale PM2.5 measurements.[1]
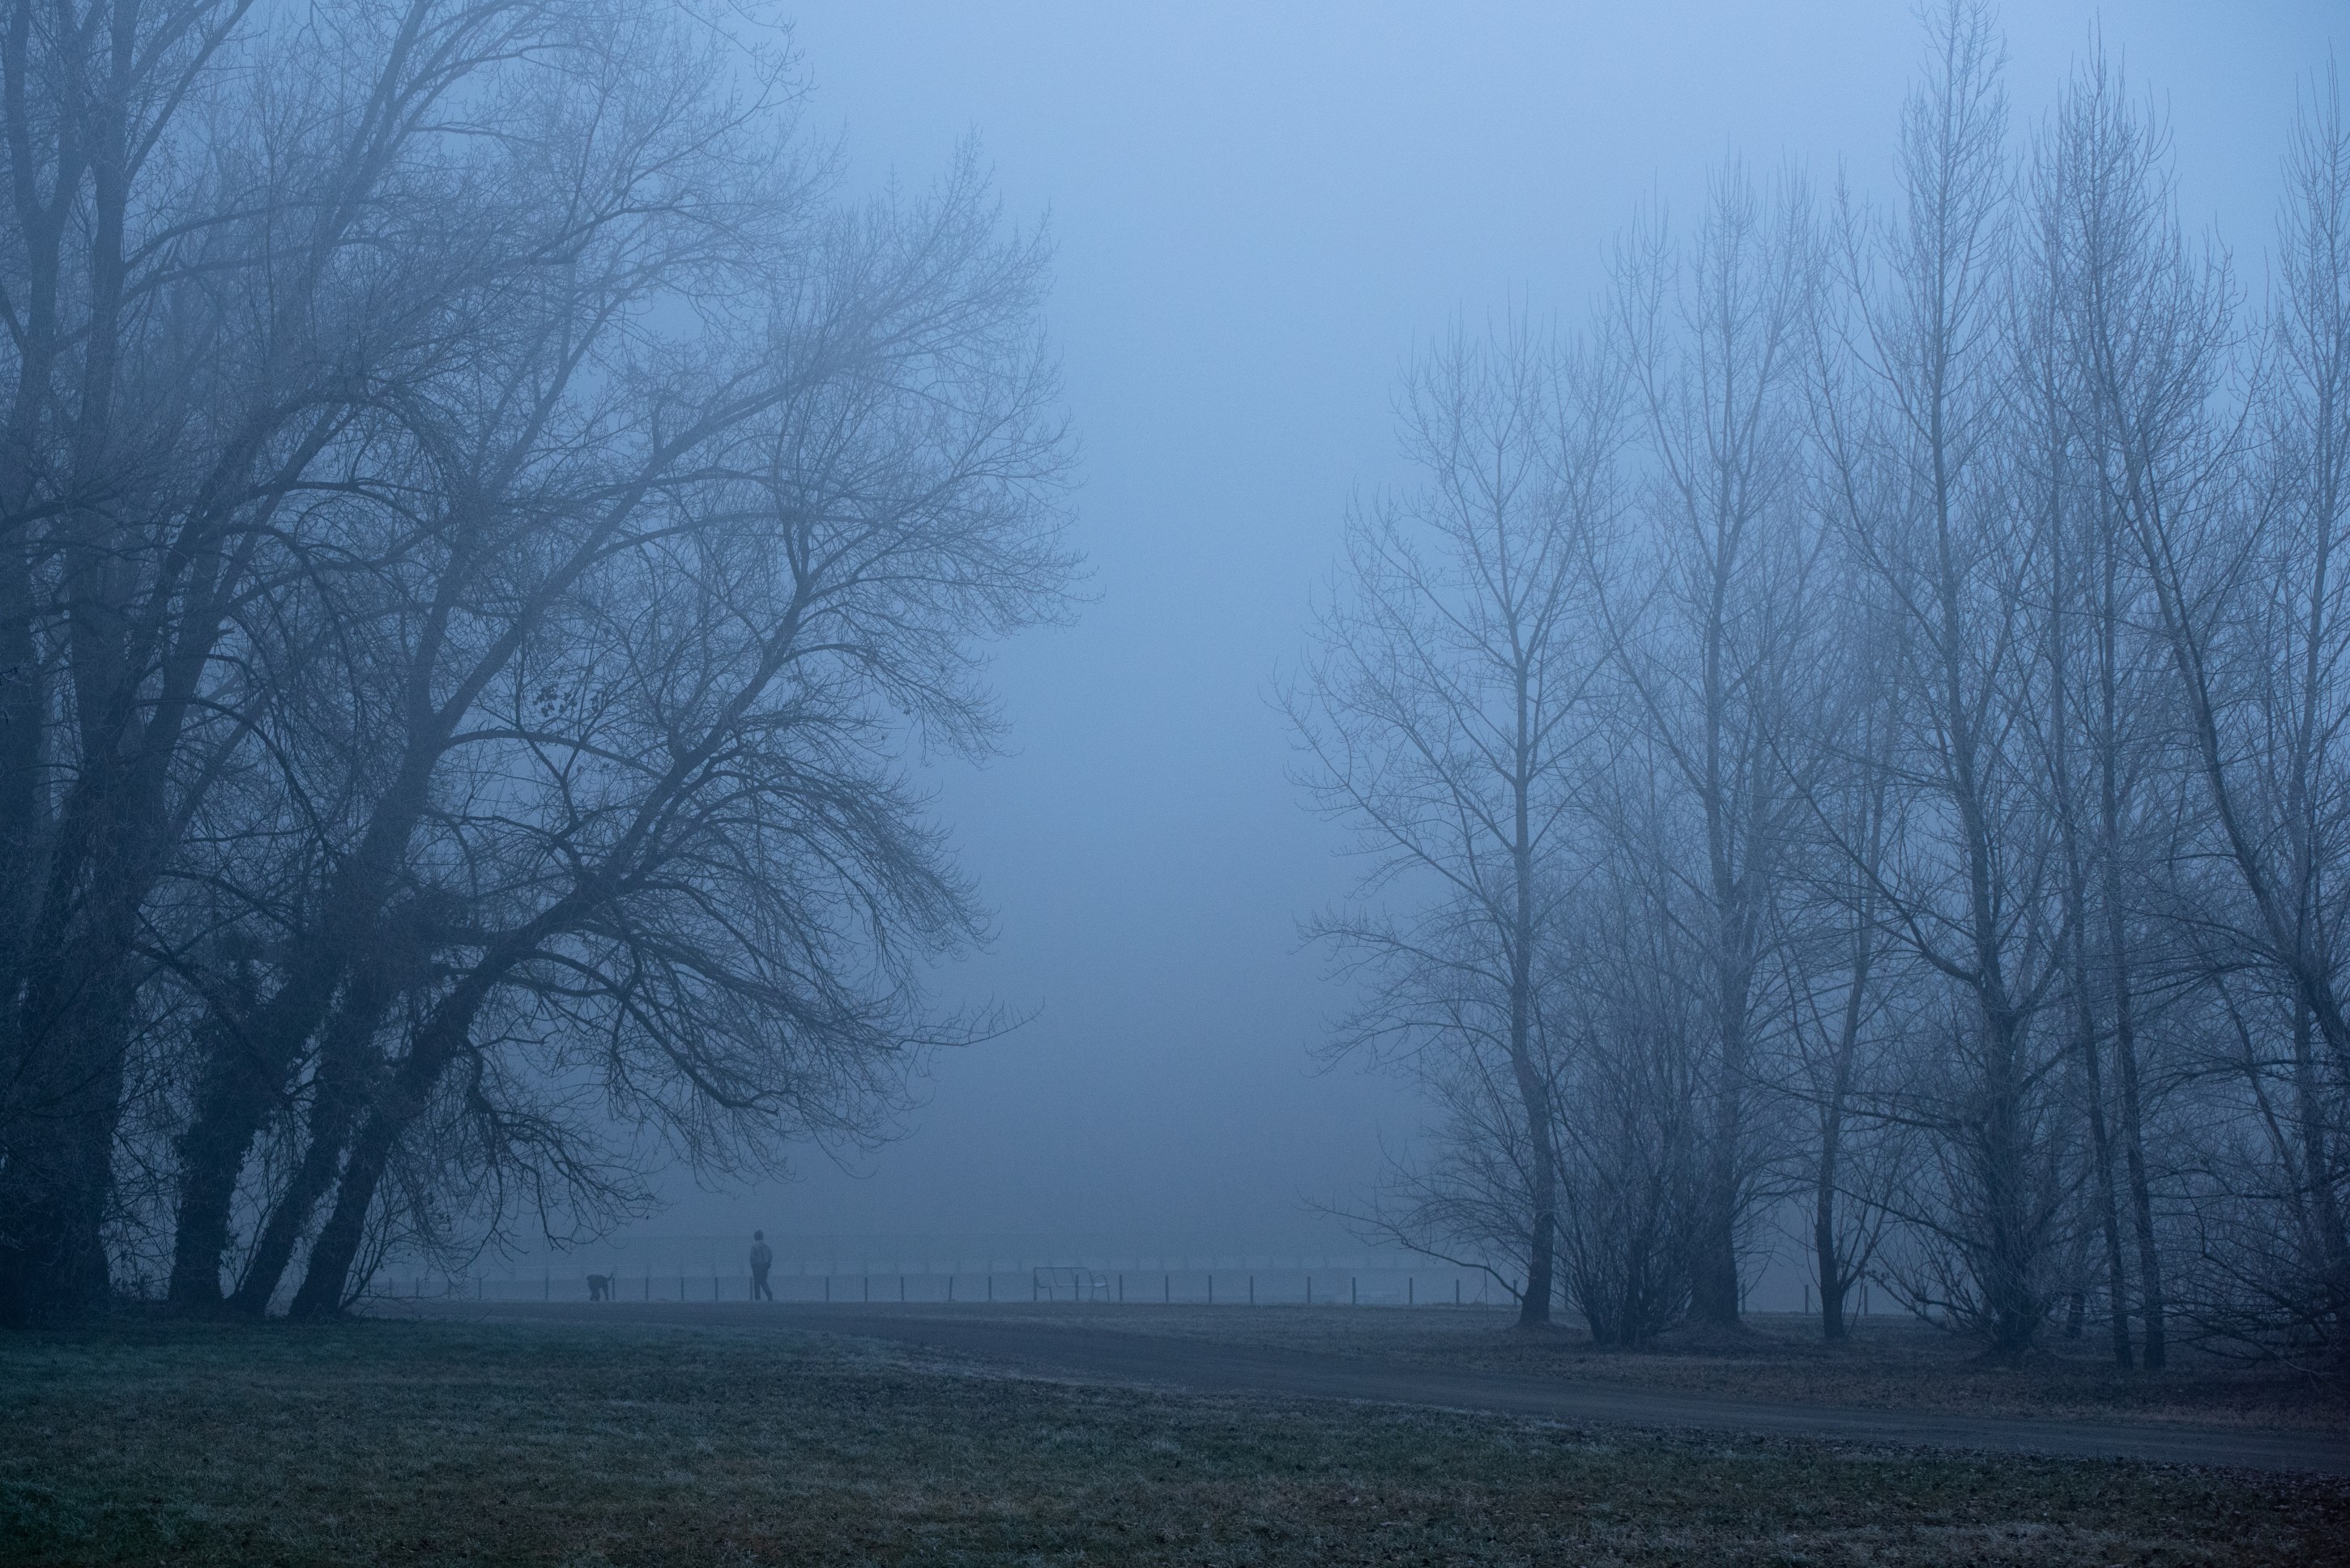
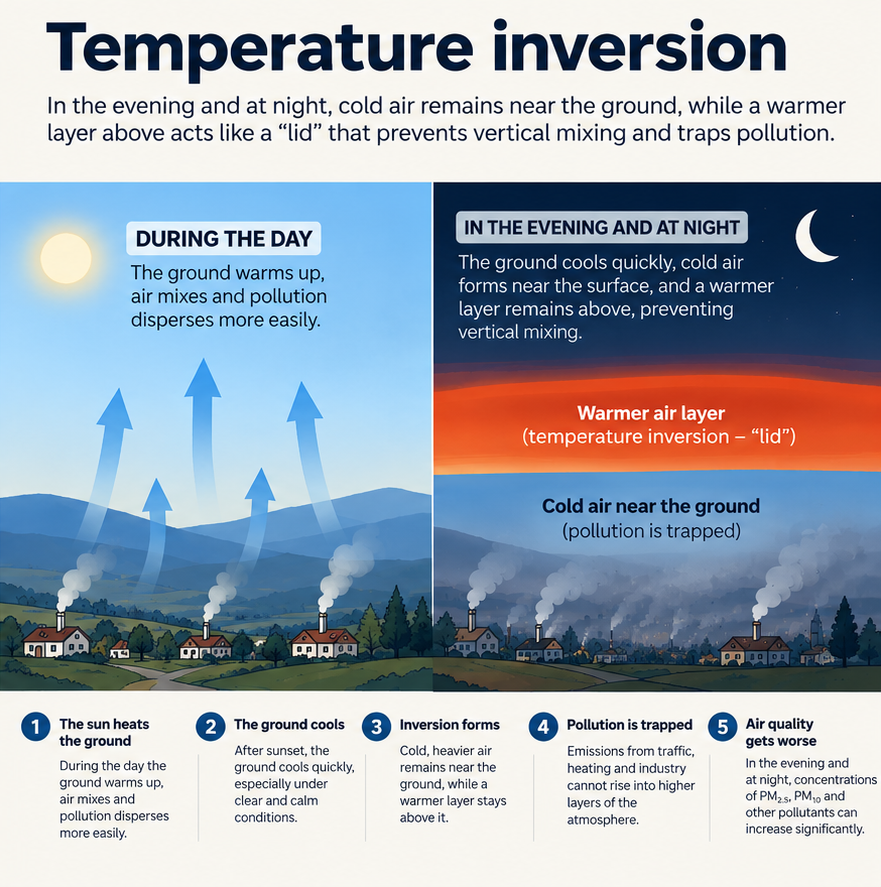
At the same time, after sunset the ground loses heat, the air near the surface cools and vertical atmospheric mixing weakens. Pollution that would be diluted through a deeper layer during daytime can remain concentrated closer to the ground.
An evening PM2.5 rise is therefore not only about how much pollution is emitted, but also about how effectively the atmosphere can dilute it.
What is a temperature inversion?
Under typical conditions, air temperature generally decreases with height, which supports vertical mixing. During a temperature inversion, the opposite occurs: colder air remains trapped near the ground while a warmer layer sits above it.
The European Environment Agency describes that warmer layer as a lid that restricts vertical mixing and traps pollution close to the surface.[2] Such conditions can develop especially during clear, calm winter nights when the ground cools rapidly.[2]
If an inversion persists for several days, pollution can accumulate. New emissions are added each evening while weak winds and a stable atmosphere fail to disperse them quickly enough.
Why does PM2.5 often rise more clearly than PM10?
Burning wood, coal and other fuels produces a large share of fine particles, which is why heating-related episodes are often especially visible in PM2.5 measurements.[1] PM10 can rise as well, but it is also more strongly influenced by coarse particles such as road and construction dust.
If PM2.5 rises steadily in the evening across several stations in the same area, especially during cold and calm weather, heating emissions combined with poor dispersion become a reasonable explanation to investigate. The graph alone, however, cannot prove an individual source.
Why can conditions improve quickly in the morning?
After sunrise, the surface begins to warm. As near-surface air warms, vertical mixing strengthens and pollution becomes distributed through a deeper atmospheric layer. Wind can accelerate the improvement.
During a prolonged high-pressure period or strong inversion, however, daytime heating may be too weak to break the stable layer. Poor air quality can then persist through the day and worsen again the following evening.[2]
Rain can also lower particle concentrations by removing some particles from the atmosphere, while wind supports dilution and transport. Two equally cold days can therefore have very different air quality.

How can you recognise the evening pattern on a graph?
One high reading tells us relatively little. A few hours or several days of data are much more useful.
A common pattern is lower values during the afternoon, a rise after sunset, elevated concentrations for part of the night and a decline in the morning as mixing returns. If the same rhythm repeats over several days and is visible at multiple nearby stations, the signal becomes more convincing.
AirQuality.city therefore shows trends, measurement time and station location alongside the current value, because a single AQI number is easy to misinterpret without context.[4]
Why can a nearby neighbourhood have very different air?
Winter pollution can be highly local. A settlement in a valley may trap cold air, while a nearby higher location can sit above the inversion layer. The number of household stoves, fuel types, traffic and terrain further change the picture.
Air quality in a city is therefore not always one number. Two stations only a few kilometres apart can show noticeably different concentrations at the same time and both can accurately describe their own micro-locations.
What are we likely to see more often as the heating season begins?
As temperatures fall, evenings with both higher heating emissions and poorer dispersion conditions become more common. The EEA continues to identify solid-fuel heating as an important source of PM2.5 emissions in Europe.[1][3]
This does not mean every winter spike is automatically caused by household heating. Traffic, industry, regional particle transport and weather also contribute to the final concentration. But when several stations show a near-synchronous PM2.5 rise on a cold, calm evening, the full 24-hour trend is worth examining before drawing conclusions.
With air quality, the time of the measurement is often as important as the number itself.
Sources
- Particulate matter - PM₂.₅ | Air quality status in Europe 2026European Environment Agency2026-06-24 Accessed 2026-09-19
- Temperature inversion traps pollution at ground levelEuropean Environment Agency Accessed 2026-09-19
- Air pollution in Europe — 2025 reporting status under the National Emission reduction Commitments DirectiveEuropean Environment Agency2025-06-26 Accessed 2026-09-19
- Jedan broj nije dovoljan: kako pravilno čitati kvalitetu zrakaAirQuality.city2026-07-24 Accessed 2026-09-19